

Sankey Chart
The Sankey chart draws weighted flows between nodes. Each row is an edge: a source, a target, and a numeric value for the link thickness. Multi-hop paths are built by stacking edge rows that share intermediate node names — one chart, many hops.
Use Sankey when your data is already an edge list (funnels, pipelines, conversion paths, energy balances) rather than a categorical matrix. Sankey is opt-in: run vizb sankey or pass -c sankey; it is not in the default bar,line,pie bundle.
How vizb builds it
Section titled “How vizb builds it”Every edge has the same three roles, in this order:
| Order | Role | Vizb field | Example column (sankey-flows.csv) |
|---|---|---|---|
| 1 | source | x |
source |
| 2 | target | y |
target |
| 3+ | value (link weight) | measure / stats | value, optional cost, … |
| Extra | Role |
|---|---|
| ZAxis | Ignored if provided — no 3D; weights still aggregate per (source, target) |
Name (n) |
Named chart panels (existing 4D behavior) — one Sankey per unique name |
Group and solo --select use that same order. Column names come from your file; roles are always source → target → value.
Sample multi-hop funnel (optional name panels + a second measure cost). Use Copy CSV, save as sankey-flows.csv, then run a command below. A clone of the repo also has examples/csv/sankey-flows.csv.
name,source,target,value,cost
web,Visit,Landing,5000,12
web,Landing,Signup,1200,8
web,Landing,Exit,3800,2
web,Signup,Trial,800,15
web,Signup,Newsletter,400,5
web,Trial,Paid,320,25
web,Trial,Churn,480,3
app,Install,Onboard,3000,10
app,Onboard,Active,1800,18
app,Onboard,Dormant,1200,4
app,Active,Subscribe,900,30
app,Active,Free,900,6
app,Subscribe,Renew,600,22
app,Subscribe,Cancel,300,5
| name | source | target | value | cost |
|---|---|---|---|---|
| web | Visit | Landing | 5000 | 12 |
| web | Landing | Signup | 1200 | 8 |
| web | Landing | Exit | 3800 | 2 |
| web | Signup | Trial | 800 | 15 |
| web | Signup | Newsletter | 400 | 5 |
| web | Trial | Paid | 320 | 25 |
| web | Trial | Churn | 480 | 3 |
| app | Install | Onboard | 3000 | 10 |
| app | Onboard | Active | 1800 | 18 |
| app | Onboard | Dormant | 1200 | 4 |
| app | Active | Subscribe | 900 | 30 |
| app | Active | Free | 900 | 6 |
| app | Subscribe | Renew | 600 | 22 |
| app | Subscribe | Cancel | 300 | 5 |
Group: list source then target under -g; -p x,y assigns those roles:
Natural-language prompt after installing the vizb skill. The agent runs the CLI.
/vizb sankey-flows.csv as sankey by source & targetvizb sankey sankey-flows.csv -g source,target -p x,y -o out.htmlPOST / on vizb serve. The API takes inlineinput, not a file path.
{ "input": "name,source,target,value,cost\nweb,Visit,Landing,5000,12\nweb,Landing,Signup,1200,8\nweb,Landing,Exit,3800,2\nweb,Signup,Trial,800,15\nweb,Signup,Newsletter,400,5\nweb,Trial,Paid,320,25\nweb,Trial,Churn,480,3\napp,Install,Onboard,3000,10\napp,Onboard,Active,1800,18\napp,Onboard,Dormant,1200,4\napp,Active,Subscribe,900,30\napp,Active,Free,900,6\napp,Subscribe,Renew,600,22\napp,Subscribe,Cancel,300,5\n", "parser": "csv", "grouping": { "columns": [ "source", "target" ], "pattern": "x,y" }, "charts": { "types": [ "sankey" ] }, "output": { "format": "html" }}GitHub Action step. Same conversion as the CLI.
- uses: goptics/vizb@v0 with: file: sankey-flows.csv group: source,target group-pattern: x,y charts: sankey output-html: out.htmlSolo --select: exactly 3 columns — source, target, value (no -g):
Natural-language prompt after installing the vizb skill. The agent runs the CLI.
/vizb sankey-flows.csv as sankey, source, target & valuevizb sankey sankey-flows.csv --select source,target,value -o out.htmlPOST / on vizb serve. The API takes inlineinput, not a file path.
{ "input": "name,source,target,value,cost\nweb,Visit,Landing,5000,12\nweb,Landing,Signup,1200,8\nweb,Landing,Exit,3800,2\nweb,Signup,Trial,800,15\nweb,Signup,Newsletter,400,5\nweb,Trial,Paid,320,25\nweb,Trial,Churn,480,3\napp,Install,Onboard,3000,10\napp,Onboard,Active,1800,18\napp,Onboard,Dormant,1200,4\napp,Active,Subscribe,900,30\napp,Active,Free,900,6\napp,Subscribe,Renew,600,22\napp,Subscribe,Cancel,300,5\n", "parser": "csv", "select": [ "source,target,value" ], "charts": { "types": [ "sankey" ] }, "output": { "format": "html" }}GitHub Action step. Same conversion as the CLI.
- uses: goptics/vizb@v0 with: file: sankey-flows.csv select: source,target,value charts: sankey output-html: out.html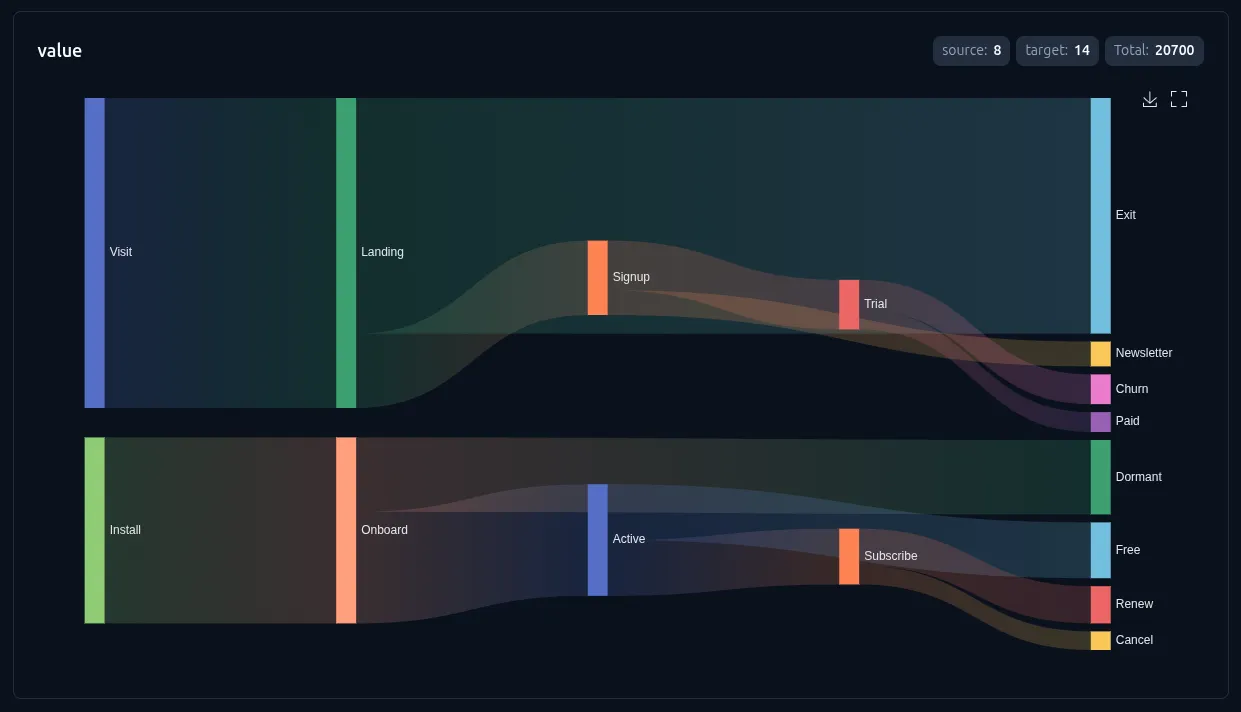
Dimensions
Section titled “Dimensions”2D edge list (source → target)
Section titled “2D edge list (source → target)”x = source, y = target, measure = flow weight. Each unique node name appears once; every row becomes (or merges into) a link.
| Approach | Flags (same column order) | Notes |
|---|---|---|
| Group | -g source,target -p x,y |
source/target as group axes; remaining numeric columns become measures |
Solo --select |
--select source,target,value |
No -g; exactly 3 columns per flag (source, target, value) |
# Group path (columns source → target)vizb sankey sankey-flows.csv -g source,target -p x,y -o out.html
# Solo --select path (exactly 3 columns: source, target, value)vizb sankey sankey-flows.csv --select source,target,value -o out.html
Another measure → another --select with the same source/target (stat tabs):
Natural-language prompt after installing the vizb skill. The agent runs the CLI.
/vizb sankey-flows.csv as sankey, source, target & value; source, target & costvizb sankey sankey-flows.csv --select source,target,value --select source,target,cost -o out.htmlPOST / on vizb serve. The API takes inlineinput, not a file path.
{ "input": "name,source,target,value,cost\nweb,Visit,Landing,5000,12\nweb,Landing,Signup,1200,8\nweb,Landing,Exit,3800,2\nweb,Signup,Trial,800,15\nweb,Signup,Newsletter,400,5\nweb,Trial,Paid,320,25\nweb,Trial,Churn,480,3\napp,Install,Onboard,3000,10\napp,Onboard,Active,1800,18\napp,Onboard,Dormant,1200,4\napp,Active,Subscribe,900,30\napp,Active,Free,900,6\napp,Subscribe,Renew,600,22\napp,Subscribe,Cancel,300,5\n", "parser": "csv", "select": [ "source,target,value", "source,target,cost" ], "charts": { "types": [ "sankey" ] }, "output": { "format": "html" }}GitHub Action step. Same conversion as the CLI.
- uses: goptics/vizb@v0 with: file: sankey-flows.csv select: | source,target,value source,target,cost charts: sankey output-html: out.htmlSolo --select for Sankey requires exactly 3 columns per flag (not 1, 2, or 4+). Extra measures use a second --select (same pattern as scatter multi-stat, but 3 cols each). The first two columns are always treated as node names (even if they look numeric).
Duplicate (source, target) pairs are summed into a single link. Multi-hop flows are just multiple edge rows that share intermediate node labels (for example Visit → Landing → Signup → Trial → Paid).
Named panels (n)
Section titled “Named panels (n)”Pass n in the group pattern to split independent edge sets into separate chart panels — same 4D behavior as other chart types.
Natural-language prompt after installing the vizb skill. The agent runs the CLI.
/vizb sankey-flows.csv as sankey by name, source & targetvizb sankey sankey-flows.csv -g name,source,target -p n,x,y -o out.htmlPOST / on vizb serve. The API takes inlineinput, not a file path.
{ "input": "name,source,target,value,cost\nweb,Visit,Landing,5000,12\nweb,Landing,Signup,1200,8\nweb,Landing,Exit,3800,2\nweb,Signup,Trial,800,15\nweb,Signup,Newsletter,400,5\nweb,Trial,Paid,320,25\nweb,Trial,Churn,480,3\napp,Install,Onboard,3000,10\napp,Onboard,Active,1800,18\napp,Onboard,Dormant,1200,4\napp,Active,Subscribe,900,30\napp,Active,Free,900,6\napp,Subscribe,Renew,600,22\napp,Subscribe,Cancel,300,5\n", "parser": "csv", "grouping": { "columns": [ "name", "source", "target" ], "pattern": "n,x,y" }, "charts": { "types": [ "sankey" ] }, "output": { "format": "html" }}GitHub Action step. Same conversion as the CLI.
- uses: goptics/vizb@v0 with: file: sankey-flows.csv group: name,source,target group-pattern: n,x,y charts: sankey output-html: out.htmlZ is ignored
Section titled “Z is ignored”If you include z in the pattern, Sankey still runs: there is no 3D scene and no layout use of z. Flow weights continue to sum per (source, target). Prefer -p x,y (or n,x,y) for clarity.
# Works, but z does not change layout — links still aggregate by source/targetvizb sankey data.csv -g source,target,channel -p x,y,z -o out.htmlMultiple measures
Section titled “Multiple measures”When the dataset has more than one numeric measure (for example value and cost), vizb keeps the usual stat tabs: one measure is active at a time, and each tab shows a single Sankey for that measure. With group active, --select can still pick which numeric columns become measures (stat pick), same as other charts.
# Two numeric columns → switch measures via stat tabs in the UIvizb sankey sankey-flows.csv -g source,target -p x,y -o out.html
# Optional: keep only one measure under groupvizb sankey sankey-flows.csv -g source,target -p x,y --select value -o out.html
Settings
Section titled “Settings”Sankey v1 supports sort, labels, and swap only — no log scale and no 3D controls.
| Setting | CLI flag | UI toggle | Notes |
|---|---|---|---|
| Sort | --sort asc|desc |
Sort control | Orders nodes / flows |
| Labels | --show-labels |
Show labels | Node names are always shown. --show-labels adds the same link values as the tooltip. |
| Swap | --swap yx |
Axis switcher | Swaps source and target (x ↔ y) |
# Labels + descending sort on the sankey subcommandvizb sankey sankey-flows.csv -g source,target -p x,y -l --sort desc -o out.html
# Root command: opt-in renderer onlyvizb sankey-flows.csv -g source,target -p x,y -c sankey -o out.htmlRoot command vs subcommand
Section titled “Root command vs subcommand”# Subcommand — single chart, flags limited to what Sankey supportsvizb sankey data.csv -g source,target -p x,y -o out.html
# Root — must opt in with -c; can combine with other renderersvizb data.csv -g source,target -p x,y -c sankey -o out.htmlvizb data.csv -g source,target -p x,y -c bar,sankey -o out.htmlFuture
Section titled “Future”-paliases on thevizb sankeysubcommand only:source/targetors/t→ still map to x / y internally; root-pvocabulary remainsn/x/y/z.