

Tables and benchmarks
CSV and JSON tables, plus Go, Rust, and JavaScript benchmark output. Format is detected from content. See Supported inputs.
npx skills add goptics/skills --skill vizbcurl -fsSL https://vizb.goptics.org/install.sh | bashirm https://vizb.goptics.org/install.ps1 | iexPoint Vizb at a CSV. Numeric columns become charts. Categorical columns become axes when you group (or when auto-group picks one for you).
After install, chart a table like this:
region,product,quantity
West,Widget,39
West,Gear,20
West,Sensor,28
West,Relay,14
West,Bolt,33
South,Widget,15
South,Gear,42
South,Sensor,47
South,Relay,22
South,Bolt,18
North,Widget,28
North,Gear,43
North,Sensor,19
North,Relay,36
North,Bolt,25
East,Widget,31
East,Gear,22
East,Sensor,35
East,Relay,12
East,Bolt,40
Central,Widget,35
Central,Gear,17
Central,Sensor,19
Central,Relay,29
Central,Bolt,24
| region | product | quantity |
|---|---|---|
| West | Widget | 39 |
| West | Gear | 20 |
| West | Sensor | 28 |
| West | Relay | 14 |
| West | Bolt | 33 |
| South | Widget | 15 |
| South | Gear | 42 |
| South | Sensor | 47 |
| South | Relay | 22 |
| South | Bolt | 18 |
| North | Widget | 28 |
| North | Gear | 43 |
| North | Sensor | 19 |
| North | Relay | 36 |
| North | Bolt | 25 |
| East | Widget | 31 |
| East | Gear | 22 |
| East | Sensor | 35 |
| East | Relay | 12 |
| East | Bolt | 40 |
| Central | Widget | 35 |
| Central | Gear | 17 |
| Central | Sensor | 19 |
| Central | Relay | 29 |
| Central | Bolt | 24 |
Natural-language prompt after installing the vizb skill. The agent runs the CLI.
/vizb sales.csv as bar by region & product, show labelsvizb bar sales.csv -g region,product -p x,y -l -o sales.htmlPOST / on vizb serve. The API takes inlineinput, not a file path.
{ "input": "region,product,quantity\nWest,Widget,39\nWest,Gear,20\nWest,Sensor,28\nWest,Relay,14\nWest,Bolt,33\nSouth,Widget,15\nSouth,Gear,42\nSouth,Sensor,47\nSouth,Relay,22\nSouth,Bolt,18\nNorth,Widget,28\nNorth,Gear,43\nNorth,Sensor,19\nNorth,Relay,36\nNorth,Bolt,25\nEast,Widget,31\nEast,Gear,22\nEast,Sensor,35\nEast,Relay,12\nEast,Bolt,40\nCentral,Widget,35\nCentral,Gear,17\nCentral,Sensor,19\nCentral,Relay,29\nCentral,Bolt,24\n", "parser": "csv", "grouping": { "columns": [ "region", "product" ], "pattern": "x,y" }, "charts": { "types": [ "bar" ], "configs": [ { "type": "bar", "showLabels": true } ] }, "output": { "format": "html" }}GitHub Action step. Same conversion as the CLI.
- uses: goptics/vizb@v0 with: file: sales.csv group: region,product group-pattern: x,y charts: bar chart: "bar:labels" output-html: sales.htmlOpen sales.html in a browser. You get a grouped bar chart: region on X, product as series, height = quantity.
Flags in this example:
bar — one chart type (smallest learning path)sales.csv — the table above (use Copy CSV to grab it)-g region,product — columns that become dimensions-p x,y — first group column → X, second → Y series-l — show value labels on bars-o sales.html — self-contained HTML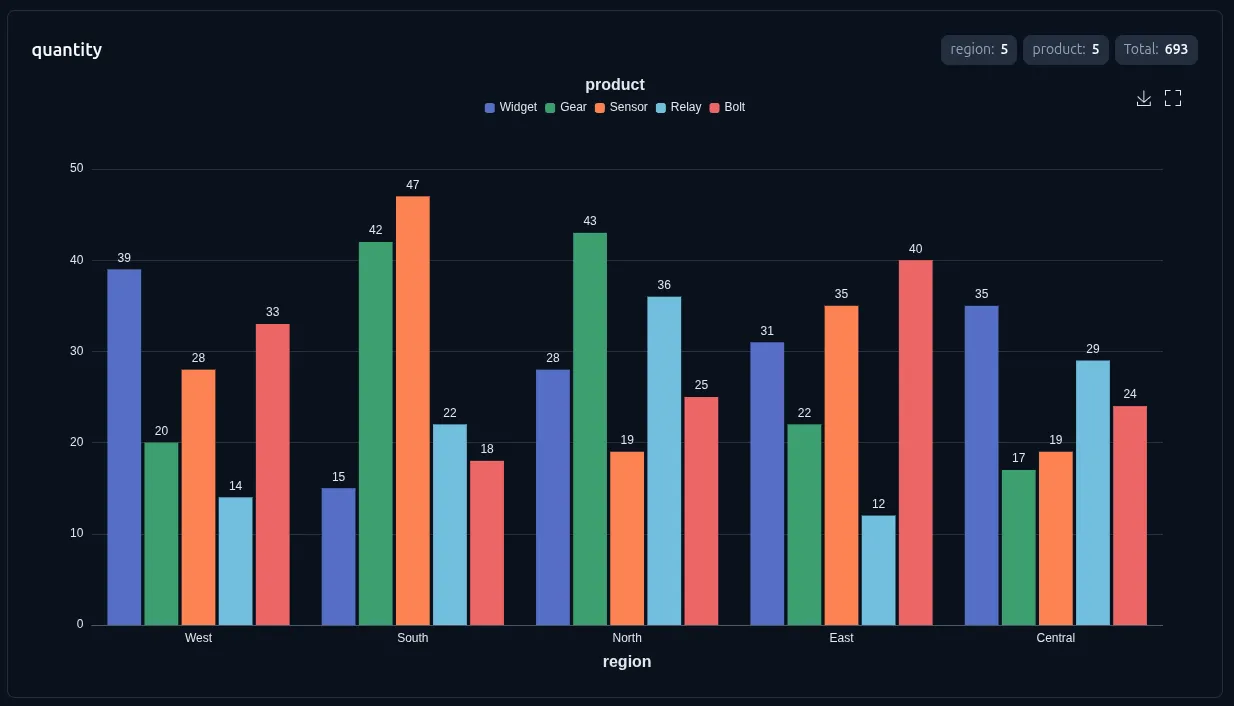
No -g? Vizb auto-groups a high-cardinality categorical column and logs the choice. Override whenever the guess is wrong.
vizb bar sales.csv -o sales.htmlFrom a clone of the Vizb repo, the full sample isexamples/csv/sales.csv (10,000 orders across 2024–2025).
Tables and benchmarks
CSV and JSON tables, plus Go, Rust, and JavaScript benchmark output. Format is detected from content. See Supported inputs.
Shared dimension model
Name, X, Y, and Z drive every chart type. Group for category breakdowns; select for coordinate plots. See Dimensions.
Self-contained HTML
Interactive UI in one file: sort, swap axes, scale, themes, JPEG export, optional stats. Open it in any browser. See UI.
CLI, agents, Action, and API
Local CLI, a coding agent via /vizb, GitHub Action, and REST for the same pipeline. Merge datasets across runs when you need history.