

Chord Chart
The Chord chart shows weighted relationships between nodes arranged around a circle. Use it for cyclic flows, reciprocal relationships, and many-to-many networks where direction matters but a left-to-right Sankey layout would be misleading.
Chord is opt-in. The default chart bundle remains bar,line,pie; run vizb chord or pass -c chord when you want the circular renderer.
Edge data
Section titled “Edge data”Chord uses the same edge contract as Sankey:
| Role | Vizb field | Example column |
|---|---|---|
| Source node | x |
source |
| Target node | y |
target |
| Link weight | active statistic | value |
Sample many-to-many network (nodes A–G, including reverse edges such as B → C and C → B). Use Copy CSV, save as chord-relations.csv, then run a command below. A clone of the repo also has examples/csv/chord-relations.csv.
source,target,value
A,B,14
A,C,8
B,C,20
B,E,15
C,B,8
C,E,3
D,A,12
D,B,3
E,A,15
E,C,5
F,C,5
G,A,6
G,B,8
G,D,4
| source | target | value |
|---|---|---|
| A | B | 14 |
| A | C | 8 |
| B | C | 20 |
| B | E | 15 |
| C | B | 8 |
| C | E | 3 |
| D | A | 12 |
| D | B | 3 |
| E | A | 15 |
| E | C | 5 |
| F | C | 5 |
| G | A | 6 |
| G | B | 8 |
| G | D | 4 |
Duplicate links in the same direction are summed. Reverse links remain separate, so B → C and C → B can have different weights. Numeric-looking source and target values remain categorical node names.
CLI usage
Section titled “CLI usage”Grouped edge data maps source to x and target to y:
Natural-language prompt after installing the vizb skill. The agent runs the CLI.
/vizb chord-relations.csv as chord by source & targetvizb chord chord-relations.csv -g source,target -p x,y -o chord.htmlPOST / on vizb serve. The API takes inlineinput, not a file path.
{ "input": "source,target,value\nA,B,14\nA,C,8\nB,C,20\nB,E,15\nC,B,8\nC,E,3\nD,A,12\nD,B,3\nE,A,15\nE,C,5\nF,C,5\nG,A,6\nG,B,8\nG,D,4\n", "parser": "csv", "grouping": { "columns": [ "source", "target" ], "pattern": "x,y" }, "charts": { "types": [ "chord" ] }, "output": { "format": "html" }}GitHub Action step. Same conversion as the CLI.
- uses: goptics/vizb@v0 with: file: chord-relations.csv group: source,target group-pattern: x,y charts: chord output-html: chord.html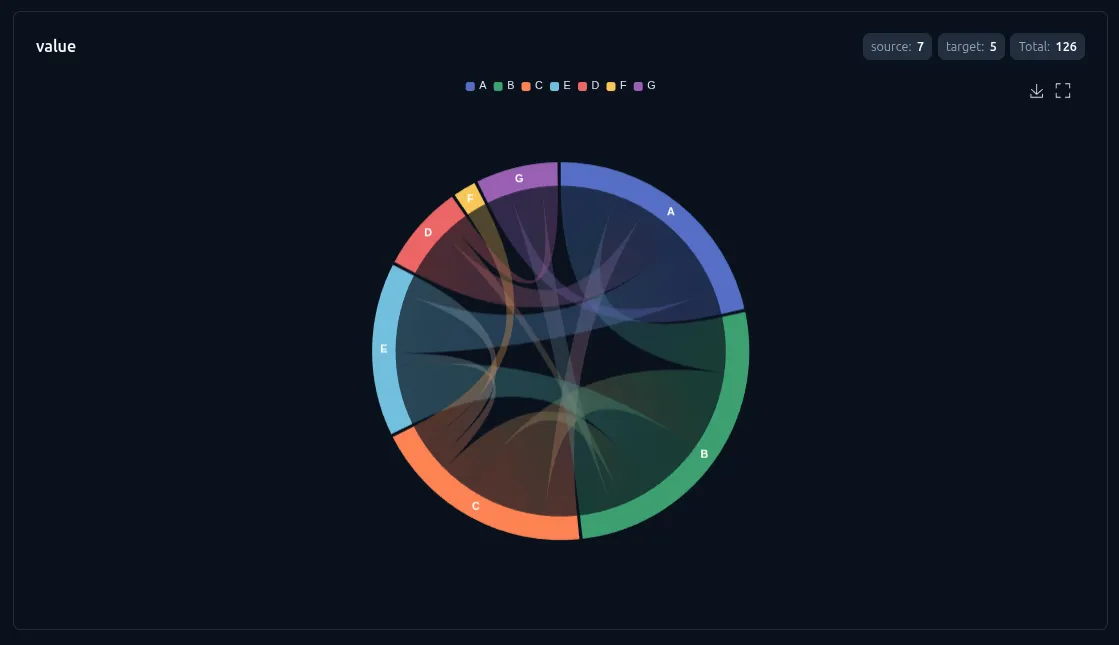
Solo selection requires exactly three columns per --select: source, target, and value.
Natural-language prompt after installing the vizb skill. The agent runs the CLI.
/vizb chord-relations.csv as chord, source, target & valuevizb chord chord-relations.csv --select source,target,value -o chord.htmlPOST / on vizb serve. The API takes inlineinput, not a file path.
{ "input": "source,target,value\nA,B,14\nA,C,8\nB,C,20\nB,E,15\nC,B,8\nC,E,3\nD,A,12\nD,B,3\nE,A,15\nE,C,5\nF,C,5\nG,A,6\nG,B,8\nG,D,4\n", "parser": "csv", "select": [ "source,target,value" ], "charts": { "types": [ "chord" ] }, "output": { "format": "html" }}GitHub Action step. Same conversion as the CLI.
- uses: goptics/vizb@v0 with: file: chord-relations.csv select: source,target,value charts: chord output-html: chord.htmlTo generate several chart types from the root command, include Chord explicitly:
Natural-language prompt after installing the vizb skill. The agent runs the CLI.
/vizb chord-relations.csv as chord & sankey by source & targetvizb chord-relations.csv -g source,target -p x,y -c chord,sankey -o relationships.htmlPOST / on vizb serve. The API takes inlineinput, not a file path.
{ "input": "source,target,value\nA,B,14\nA,C,8\nB,C,20\nB,E,15\nC,B,8\nC,E,3\nD,A,12\nD,B,3\nE,A,15\nE,C,5\nF,C,5\nG,A,6\nG,B,8\nG,D,4\n", "parser": "csv", "grouping": { "columns": [ "source", "target" ], "pattern": "x,y" }, "charts": { "types": [ "chord", "sankey" ] }, "output": { "format": "html" }}GitHub Action step. Same conversion as the CLI.
- uses: goptics/vizb@v0 with: file: chord-relations.csv group: source,target group-pattern: x,y charts: chord,sankey output-html: relationships.htmlMultiple measures and named panels
Section titled “Multiple measures and named panels”Repeat --select for additional measures. Every repeated view must reuse the same source and target columns; each measure becomes a statistic tab.
Natural-language prompt after installing the vizb skill. The agent runs the CLI.
/vizb relations.csv as chord, source, target & value; source, target & costvizb relations.csv --select source,target,value --select source,target,cost -c chord -o relationships.htmlPOST / on vizb serve. The API takes inlineinput, not a file path.
{ "input": "source,target,value\nA,B,14\nA,C,8\nB,C,20\nB,E,15\nC,B,8\nC,E,3\nD,A,12\nD,B,3\nE,A,15\nE,C,5\nF,C,5\nG,A,6\nG,B,8\nG,D,4\n", "parser": "csv", "select": [ "source,target,value", "source,target,cost" ], "charts": { "types": [ "chord" ] }, "output": { "format": "html" }}GitHub Action step. Same conversion as the CLI.
- uses: goptics/vizb@v0 with: file: relations.csv select: | source,target,value source,target,cost charts: chord output-html: relationships.htmlUse n to split independent edge sets into named panels, just like other Vizb chart types:
Natural-language prompt after installing the vizb skill. The agent runs the CLI.
/vizb relations.csv as chord by name, source & targetvizb relations.csv -g name,source,target -p n,x,y -c chord -o panels.htmlPOST / on vizb serve. The API takes inlineinput, not a file path.
{ "input": "source,target,value\nA,B,14\nA,C,8\nB,C,20\nB,E,15\nC,B,8\nC,E,3\nD,A,12\nD,B,3\nE,A,15\nE,C,5\nF,C,5\nG,A,6\nG,B,8\nG,D,4\n", "parser": "csv", "grouping": { "columns": [ "name", "source", "target" ], "pattern": "n,x,y" }, "charts": { "types": [ "chord" ] }, "output": { "format": "html" }}GitHub Action step. Same conversion as the CLI.
- uses: goptics/vizb@v0 with: file: relations.csv group: name,source,target group-pattern: n,x,y charts: chord output-html: panels.htmlZ is ignored by Chord. It does not create a third visual dimension or a separate node axis; links continue to aggregate by (source, target).
Settings
Section titled “Settings”Chord supports the initial edge-chart settings:
| Setting | CLI | UI | Effect |
|---|---|---|---|
| Sort | --sort asc|desc |
Sort control | Orders nodes by total relationship weight |
| Labels | --show-labels |
Show labels | Shows node labels around the circle |
| Legend | (always on) | Legend | Lists nodes with colors; click to focus via legend hover |
| Swap | --swap yx |
Axis switcher | Reverses source and target roles |
| Statistics | --stat |
Stats panel | Enables the shared statistics panel |
Scale, stacking, 3D, and visual-map settings do not apply to Chord.
Chord or Sankey?
Section titled “Chord or Sankey?”- Choose Chord for cycles, reciprocal edges, and dense many-to-many relationships where circular adjacency is the important structure.
- Choose Sankey for staged, mostly left-to-right flows where path progression and flow conservation are the important structure.
Both charts share the same source/target/value data model, duplicate-link aggregation, named panels, repeated measures, and Z-ignored behavior.